A dashboard that starts with the numbers
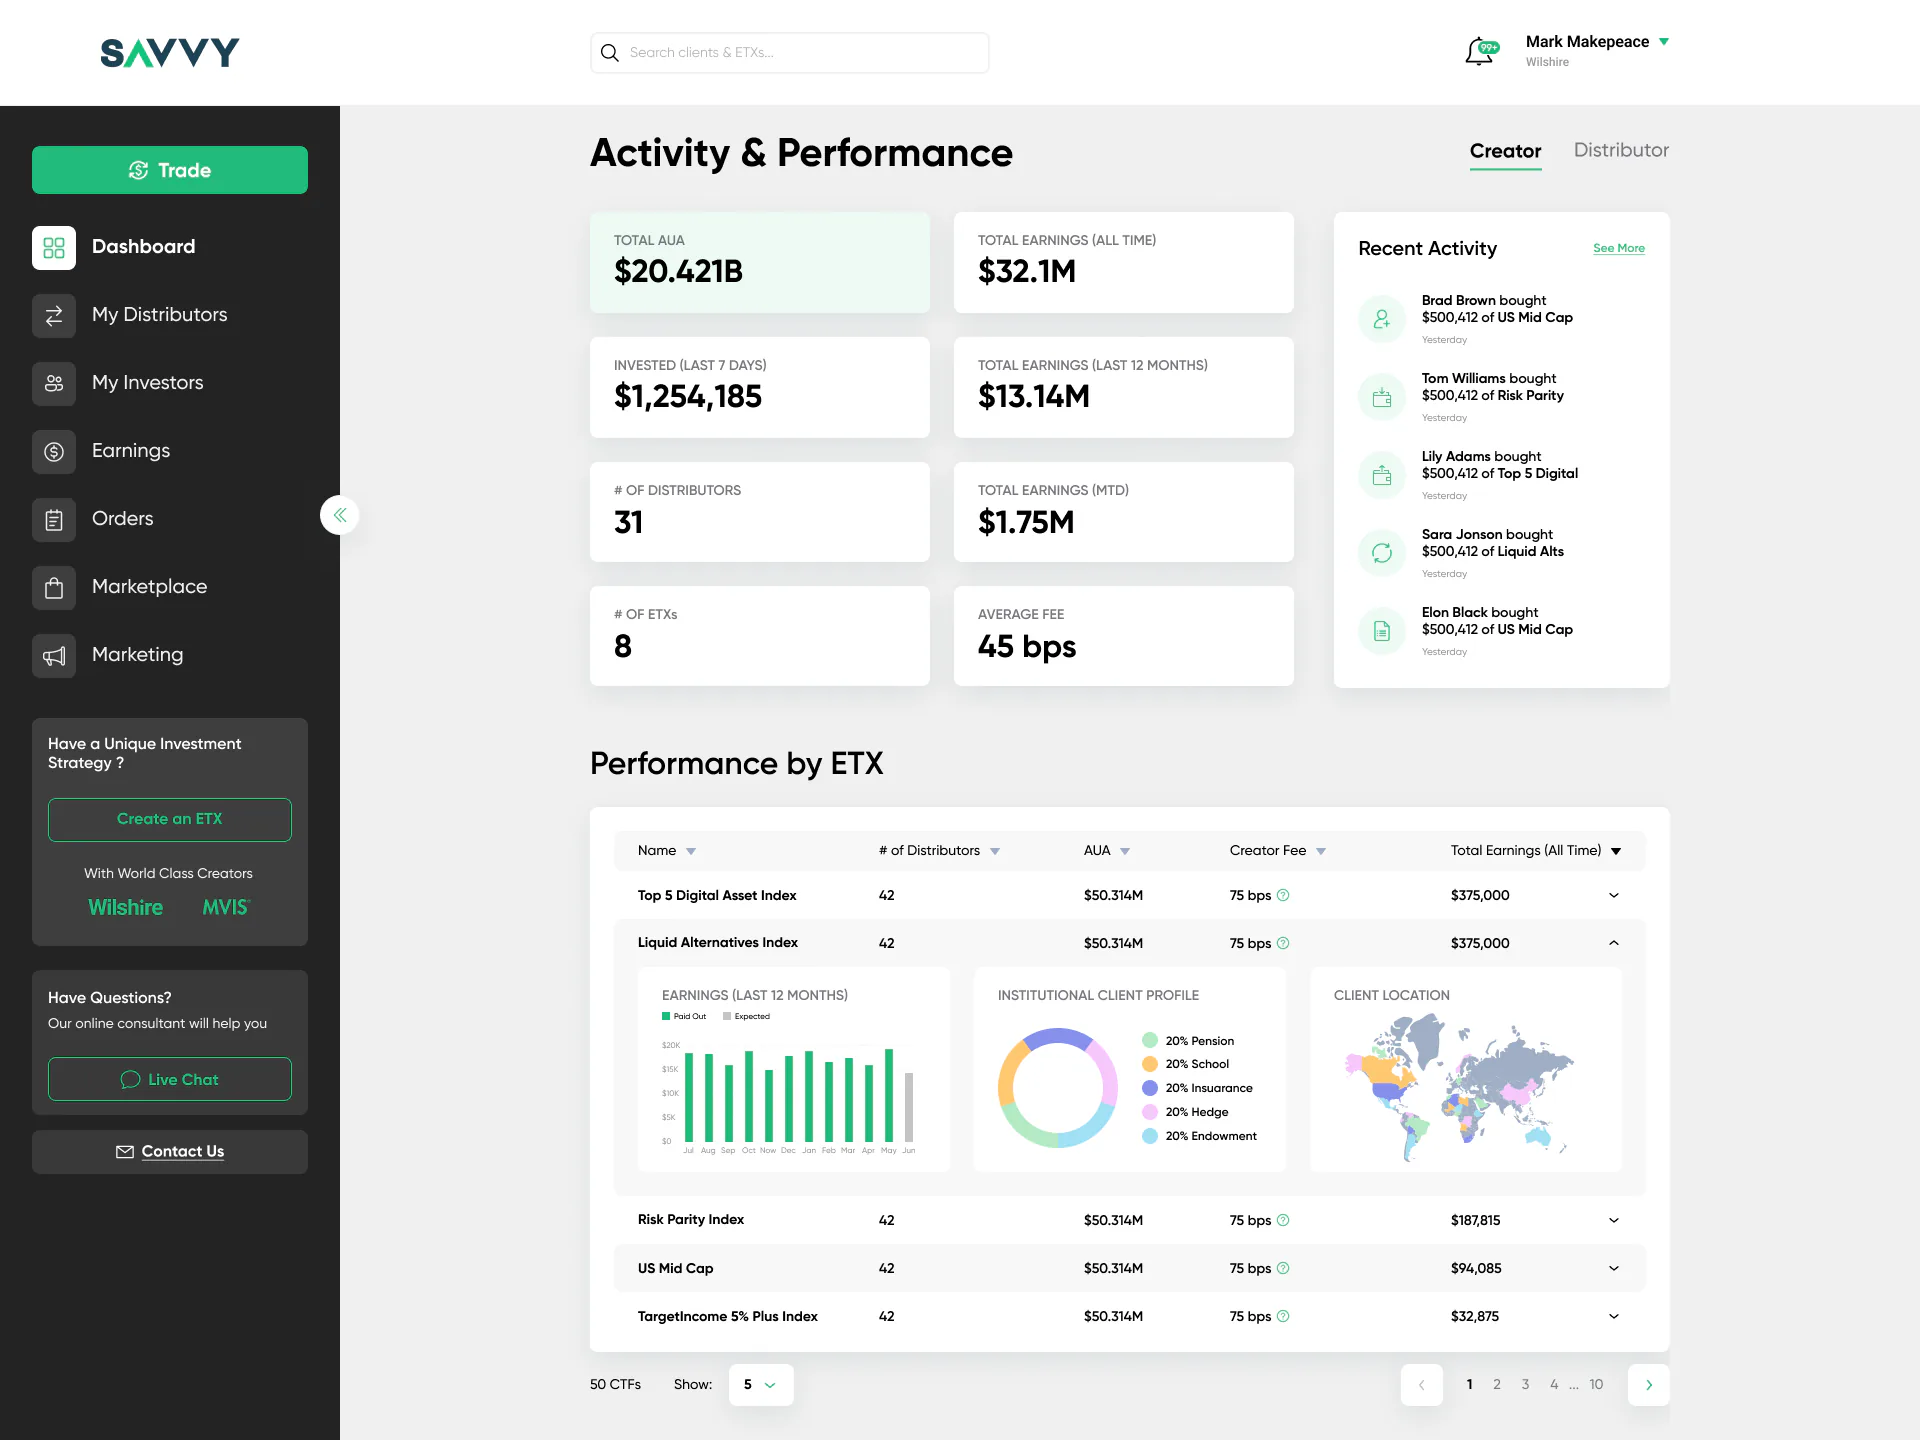
Key numbers on top, recent activity on the side, and a table of ETXs where each row opens into charts: earnings by month, client profile and client location.
Case study · 2022–2023
An investment platform where creators build thematic products (ETXs), distributors offer them to clients and investors buy them.

The task
Savvy brings together the people who create investment products, the people who sell them, the people who buy them, and the team that keeps it all running.
Each role needed its own view of the same data, in one consistent interface:
How I worked
The product was built from scratch. The client came with wireframes, and our work was mostly the UI. I was the main designer and worked on my own for most of the project; near the end, when the workload grew, a second designer joined part-time.
Key decisions
Seven parts of one product, from the first dashboard to the admin panel.
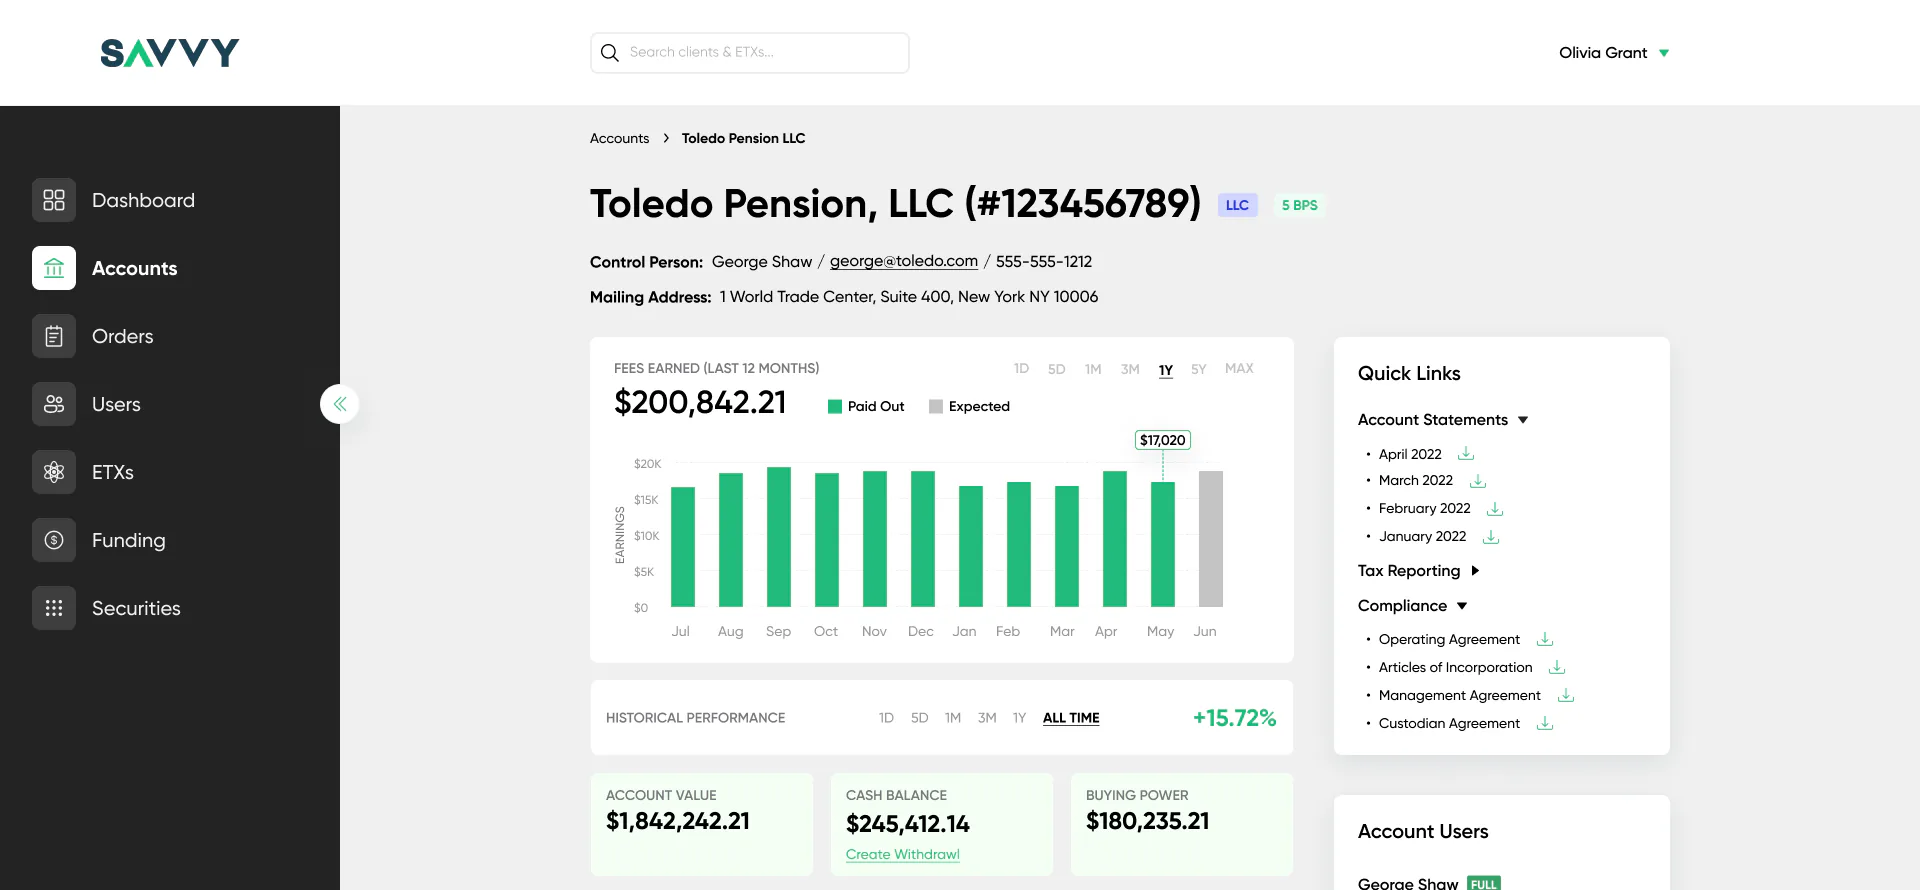
Key numbers on top, recent activity on the side, and a table of ETXs where each row opens into charts: earnings by month, client profile and client location.
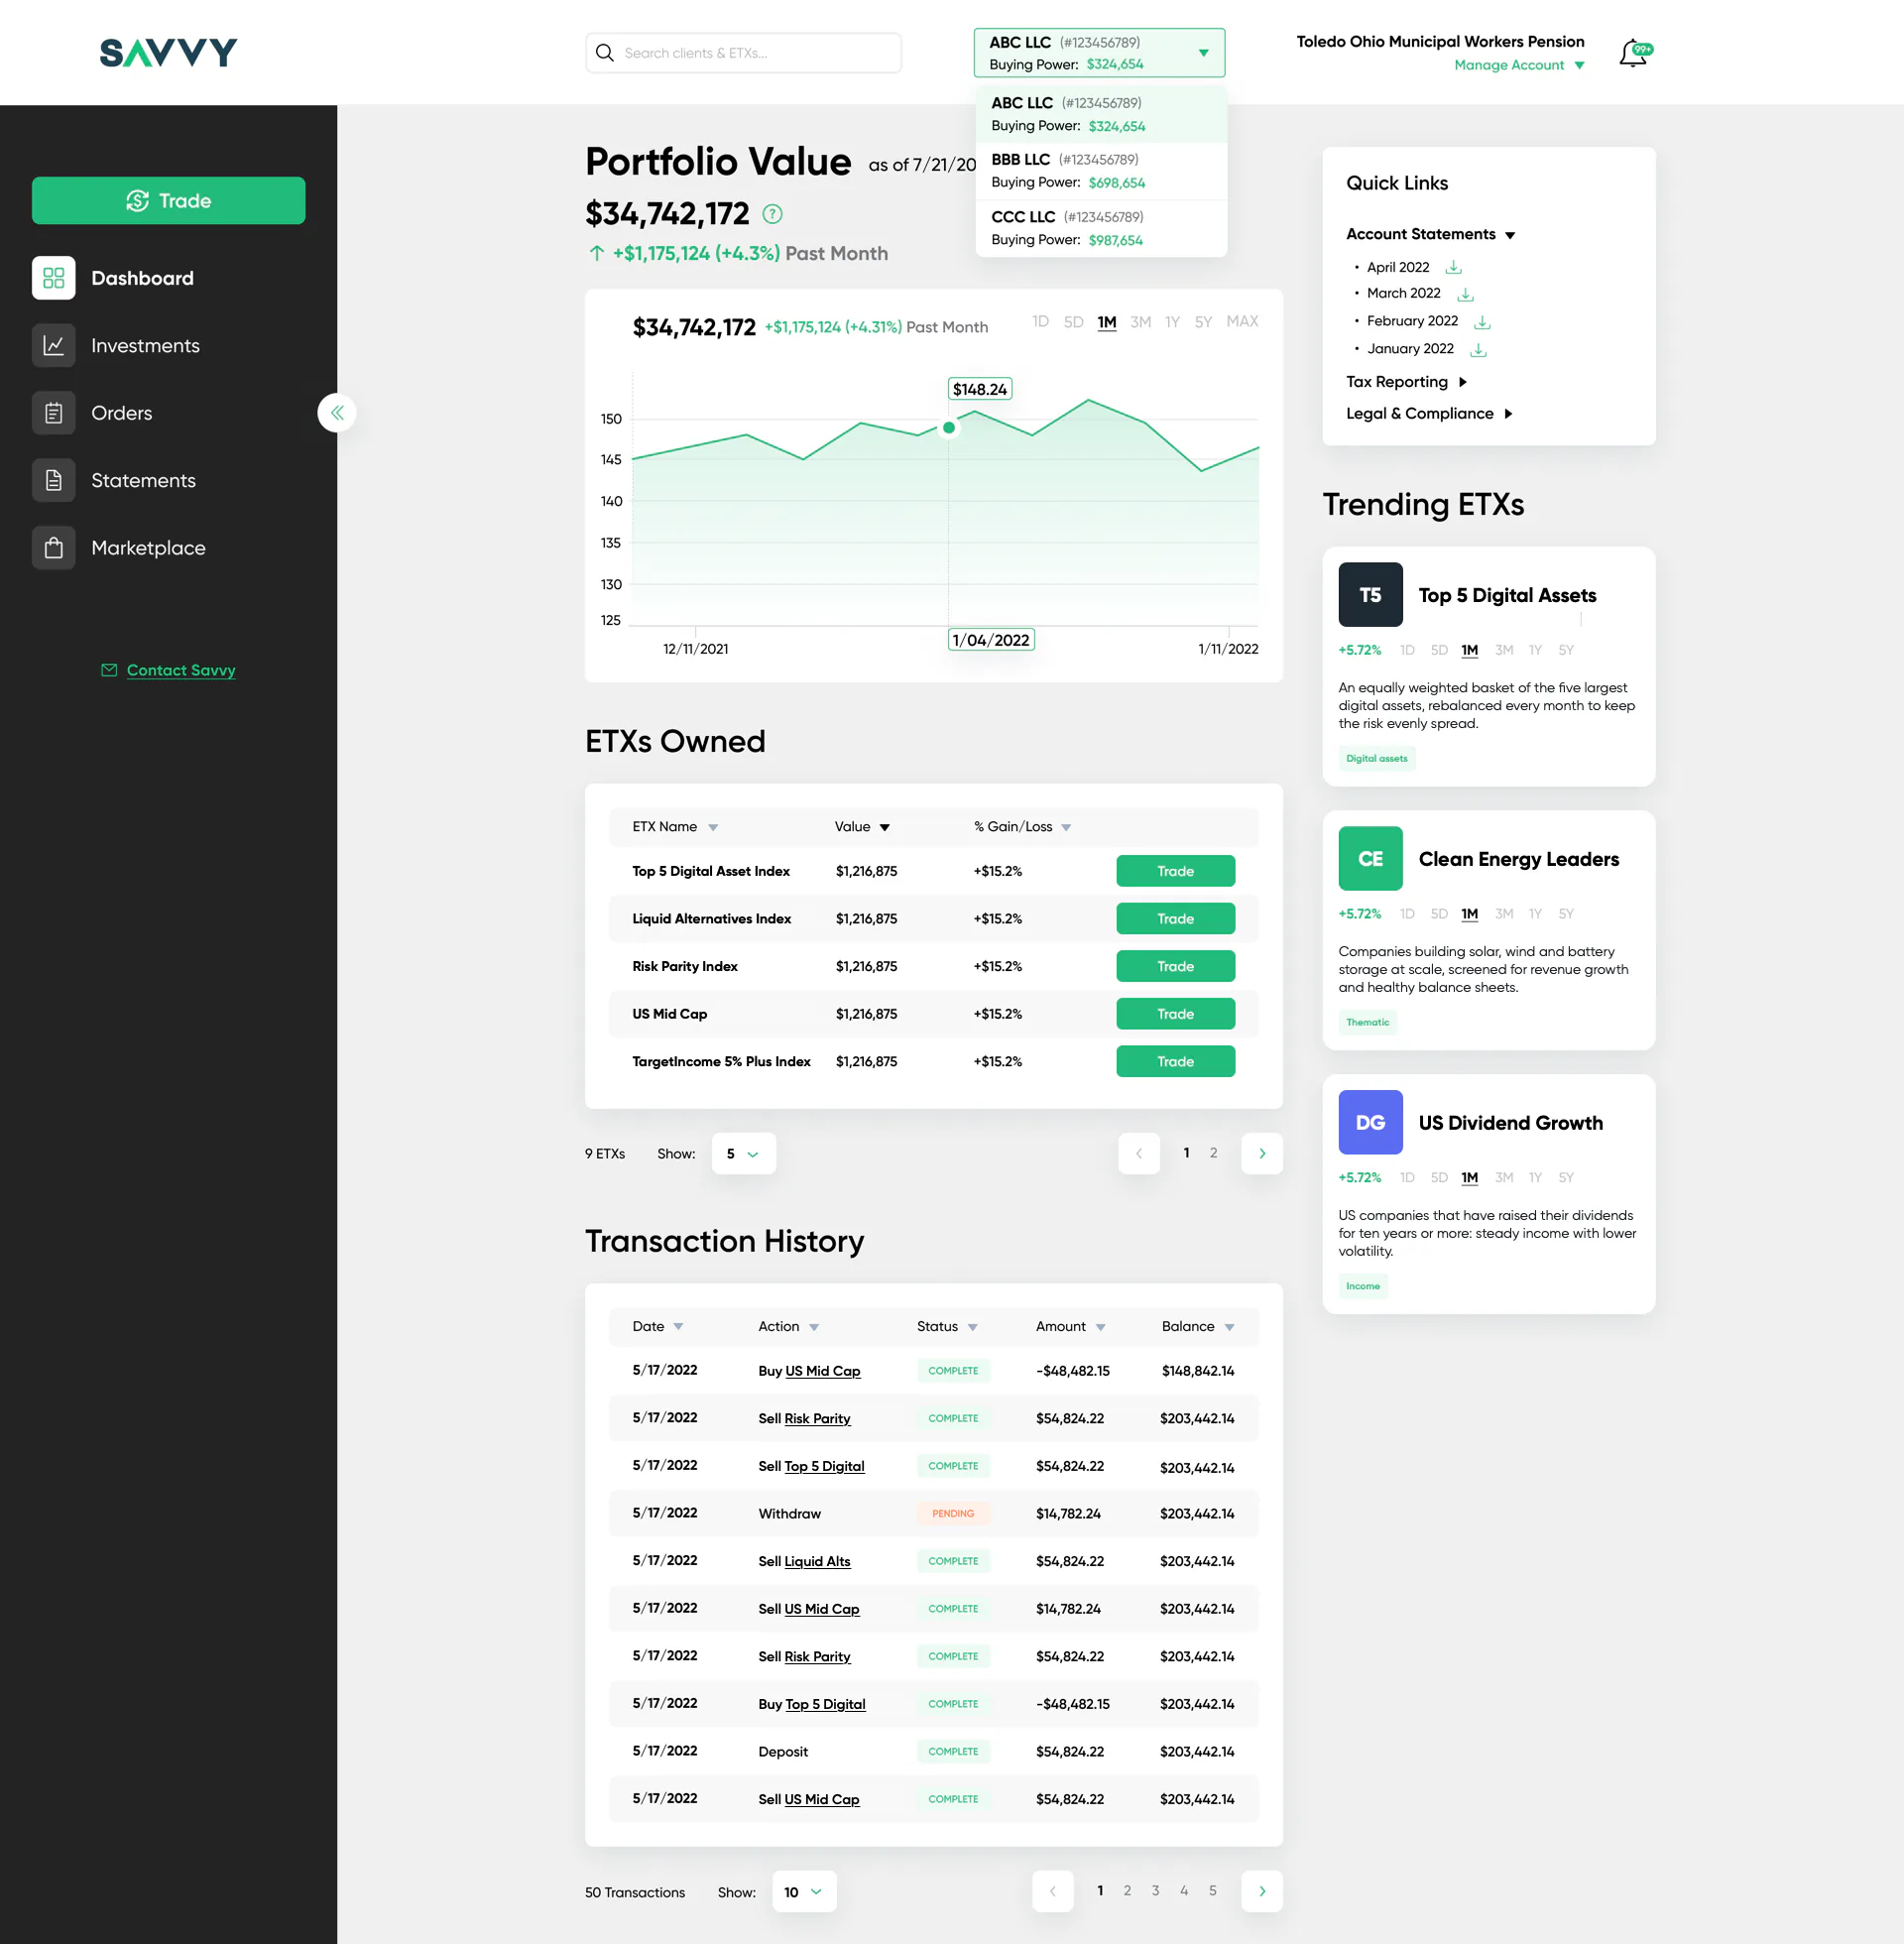
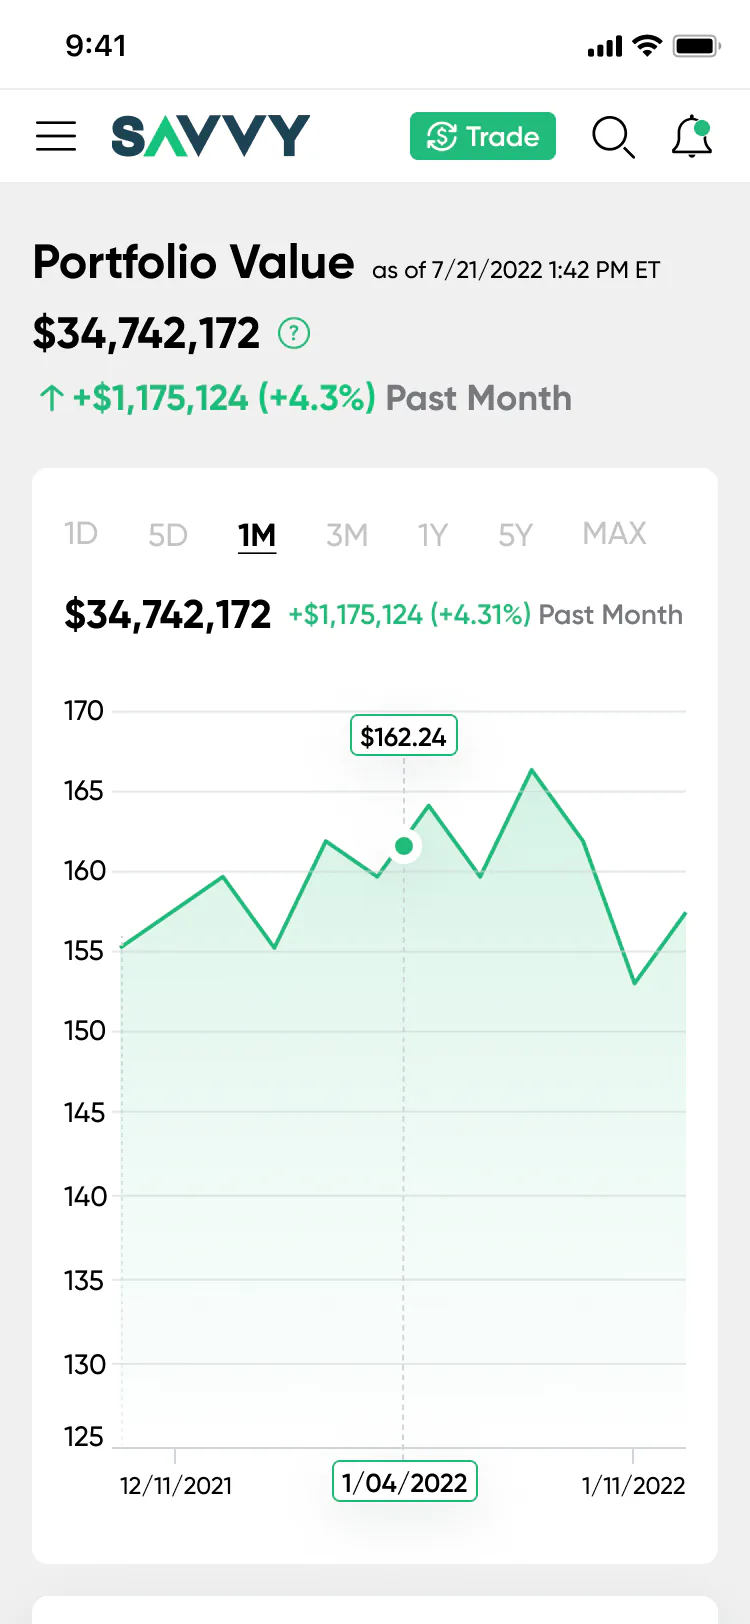
Portfolio value with a chart and a period switch, an account switcher with buying power in the header, a Trade button next to every ETX, and the full transaction history.
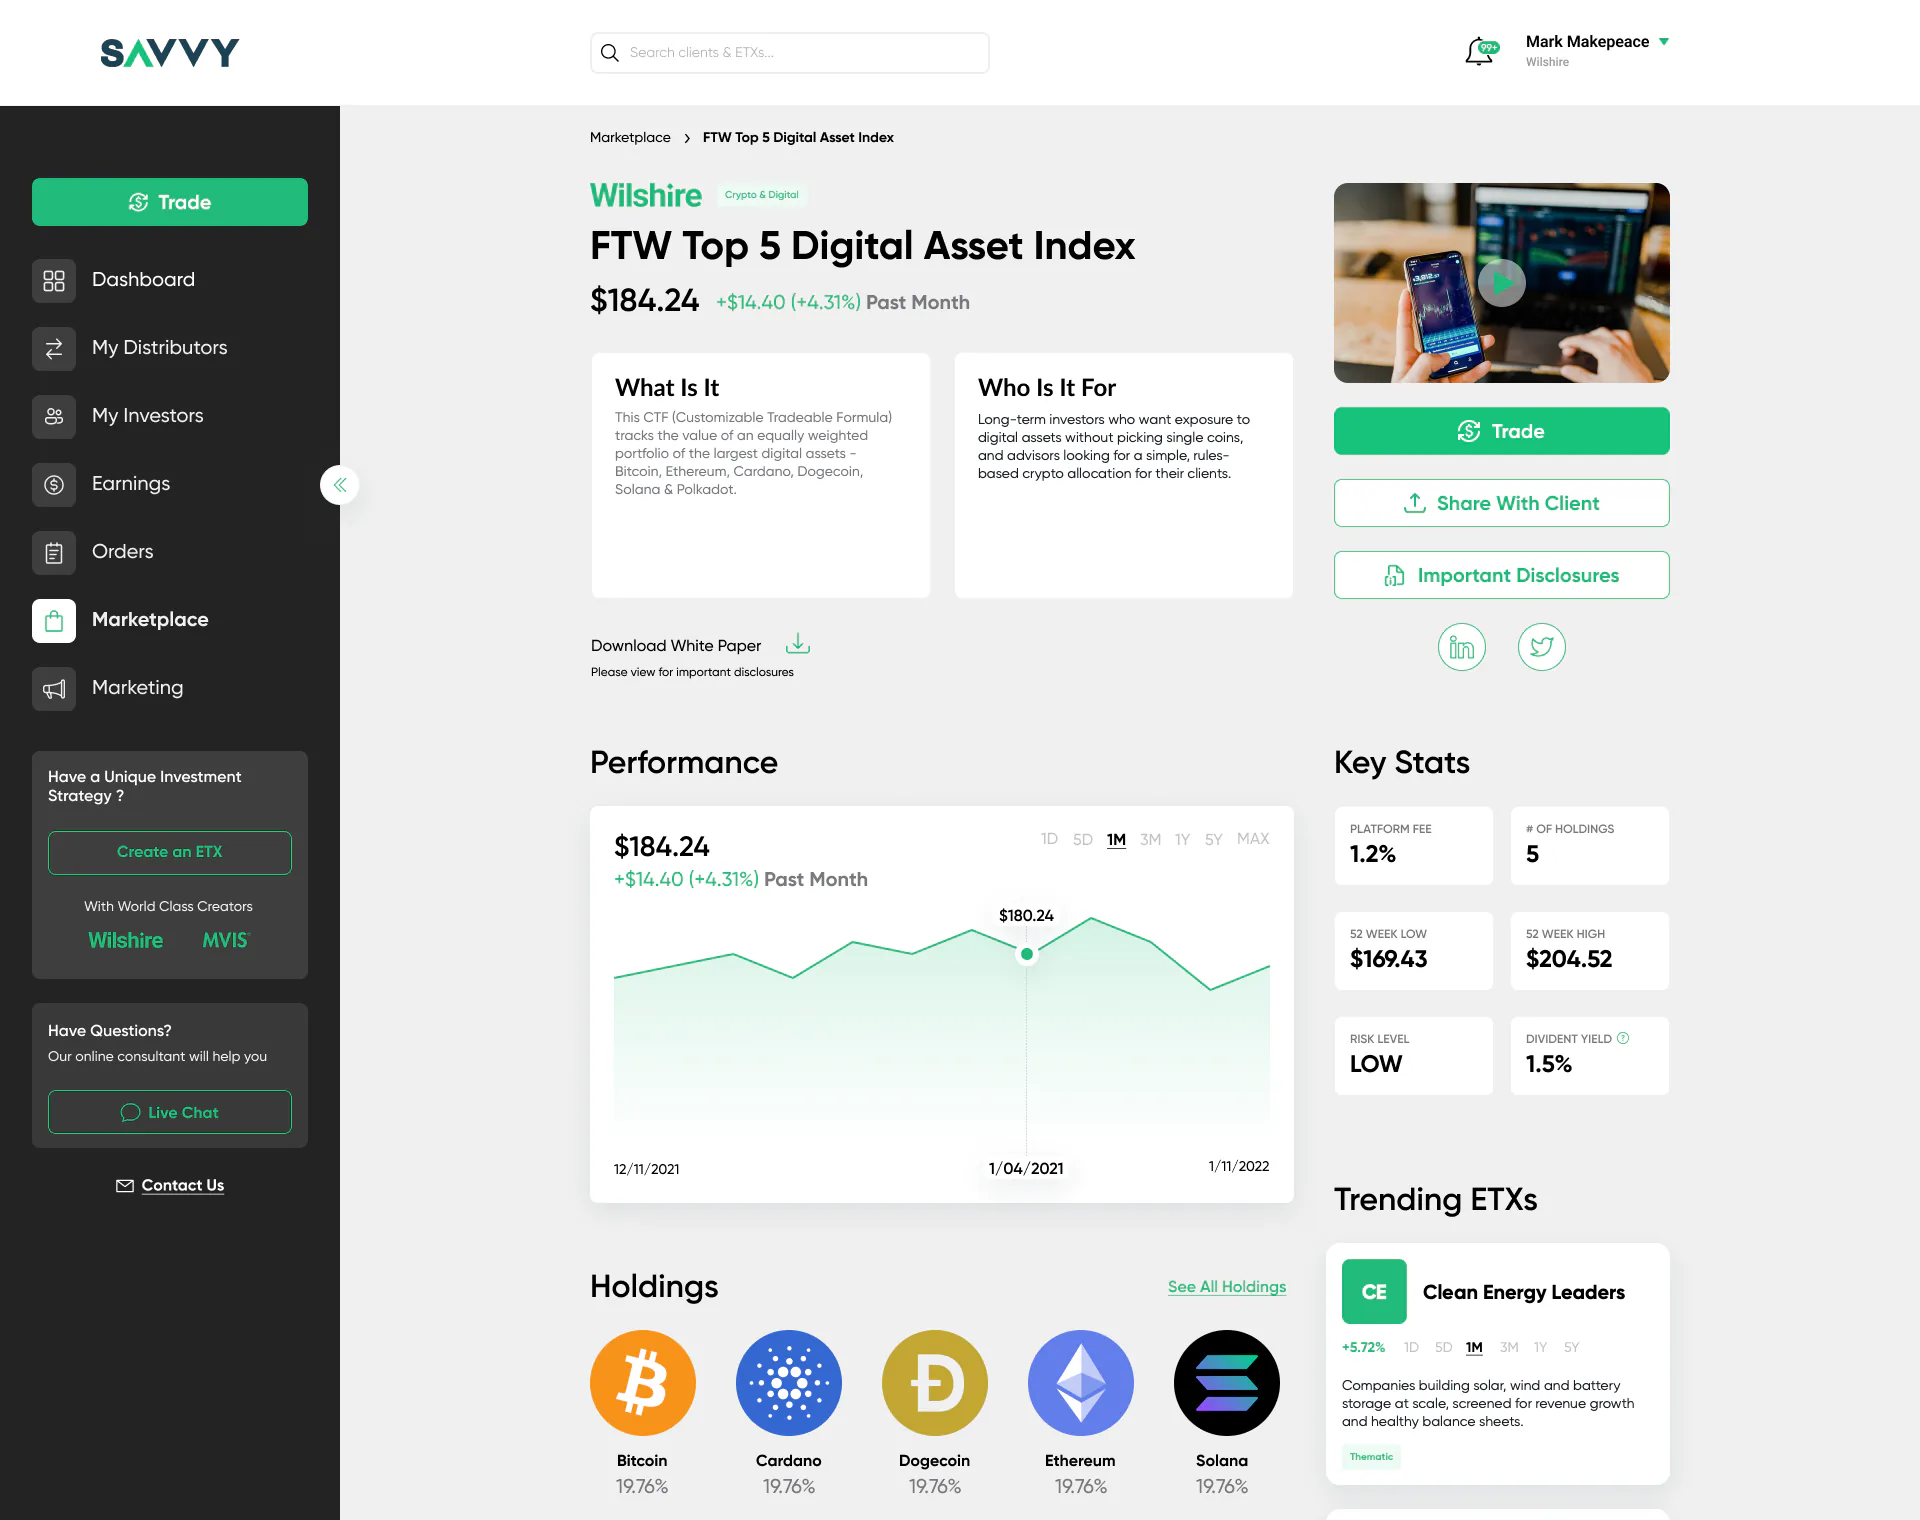
What it is and who it is for, performance with a period switch, key stats and holdings. Trade, share with a client and the disclosures sit together in the right column.
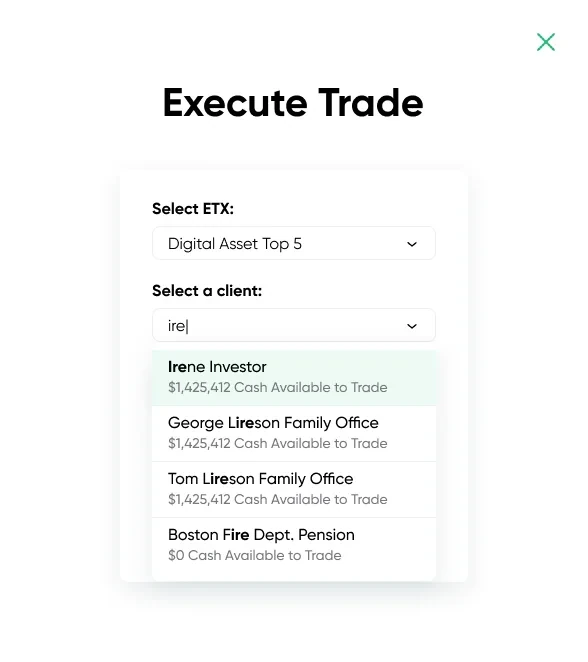
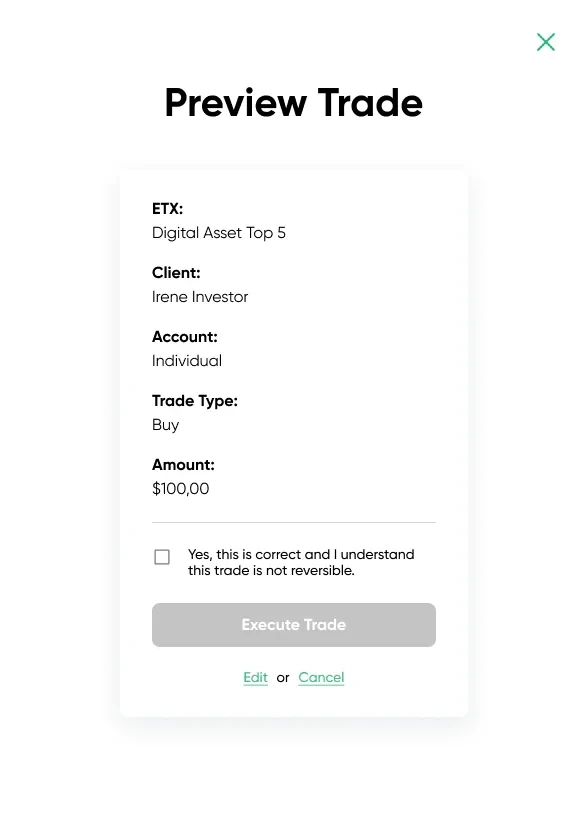
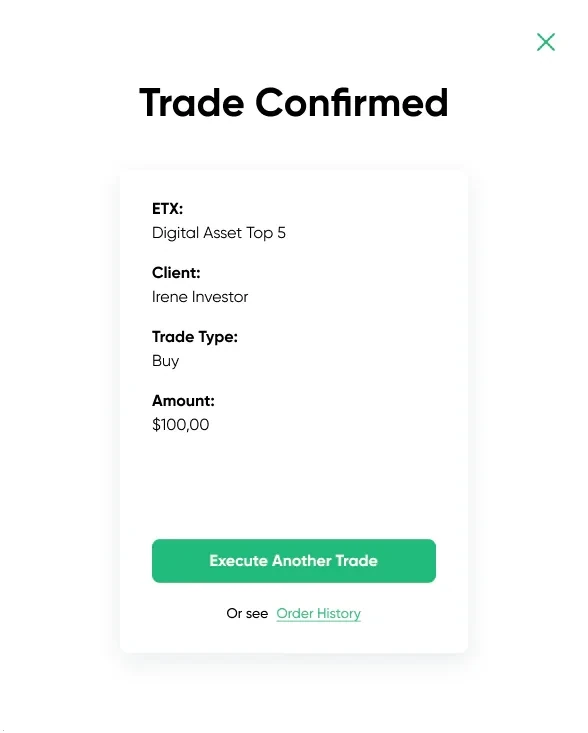
Three steps: choose the ETX, the client and the account; preview every detail; confirm. A trade can’t be undone, so the button stays inactive until the person confirms the details are correct.
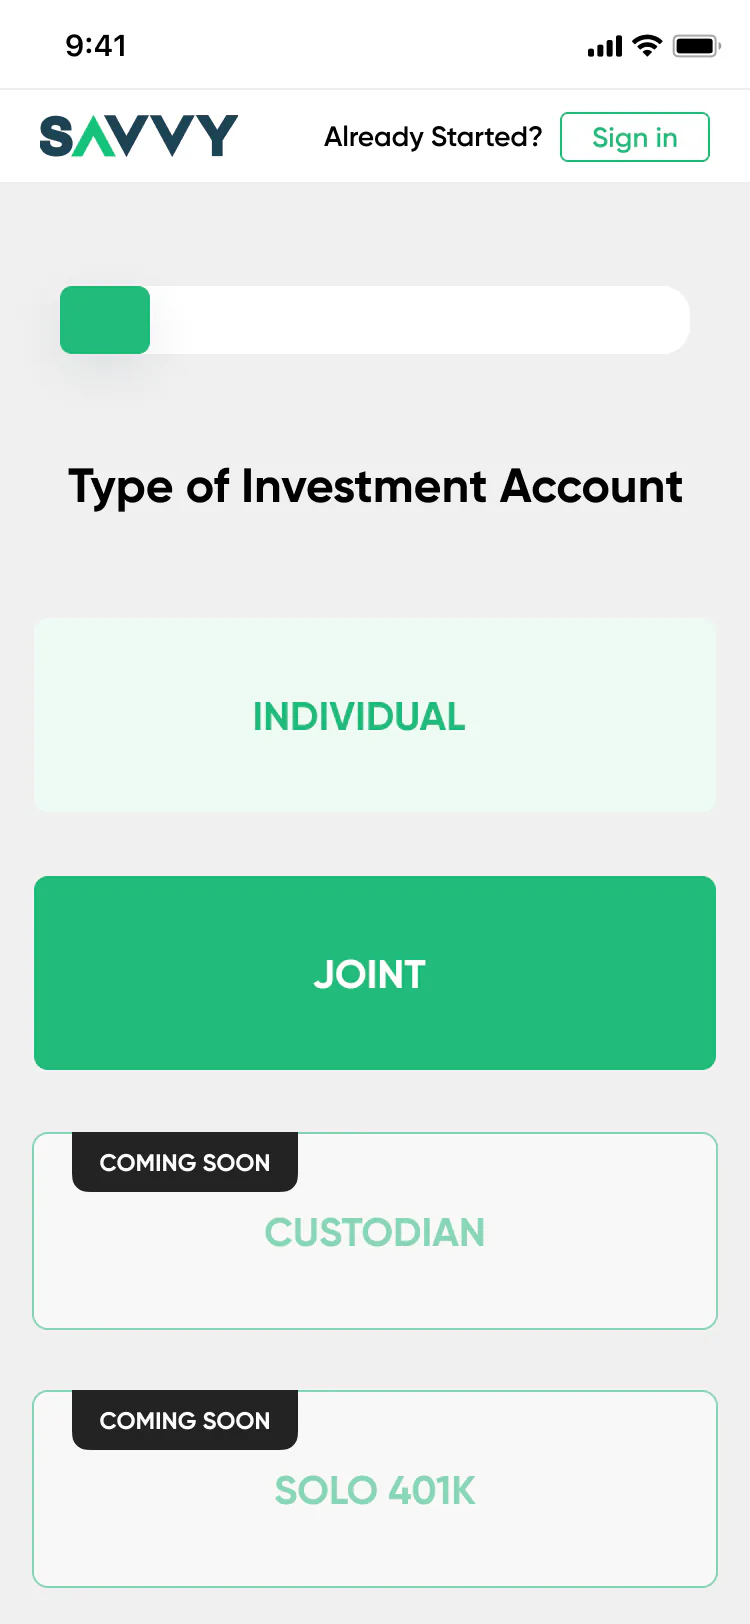
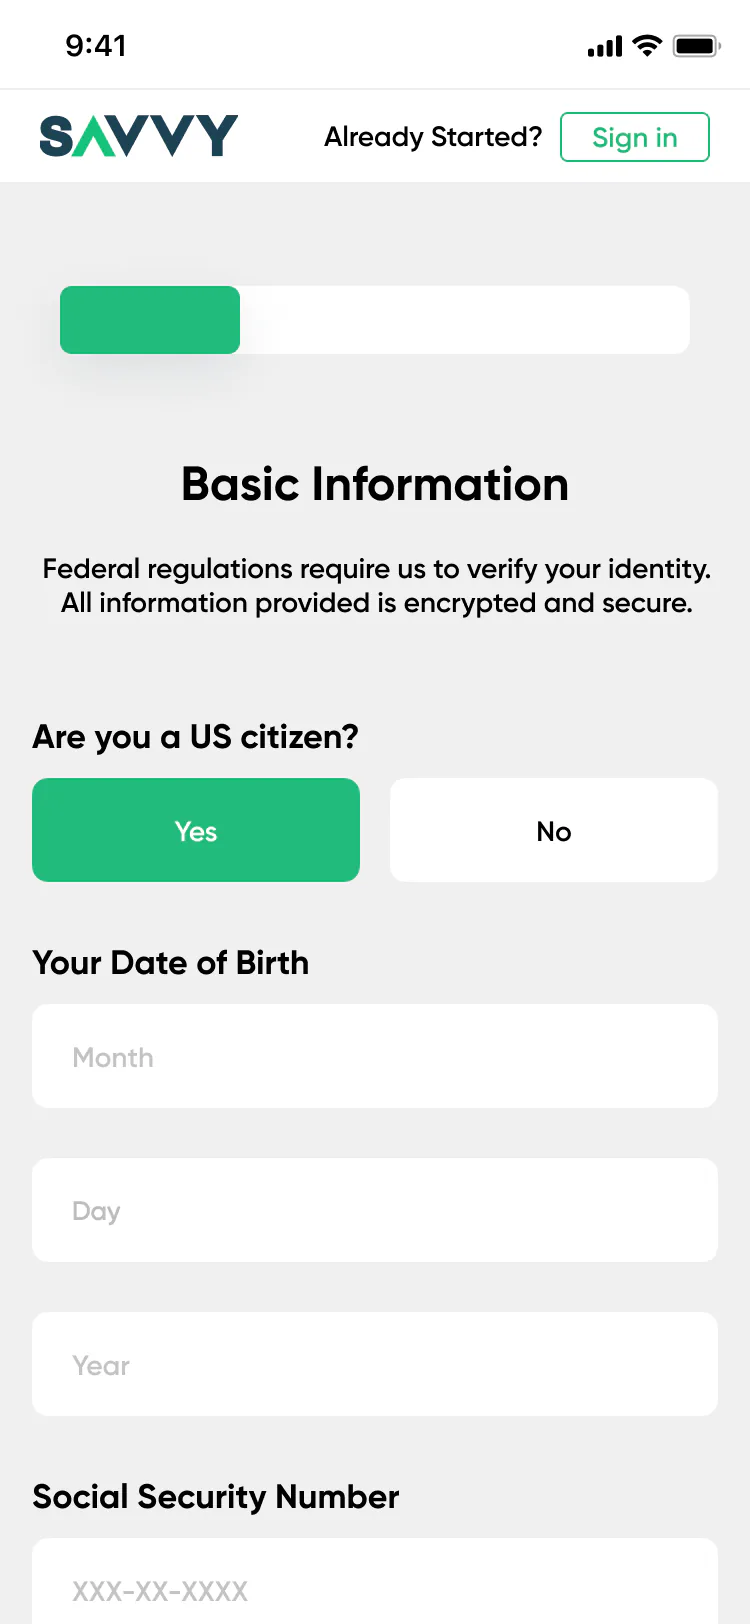
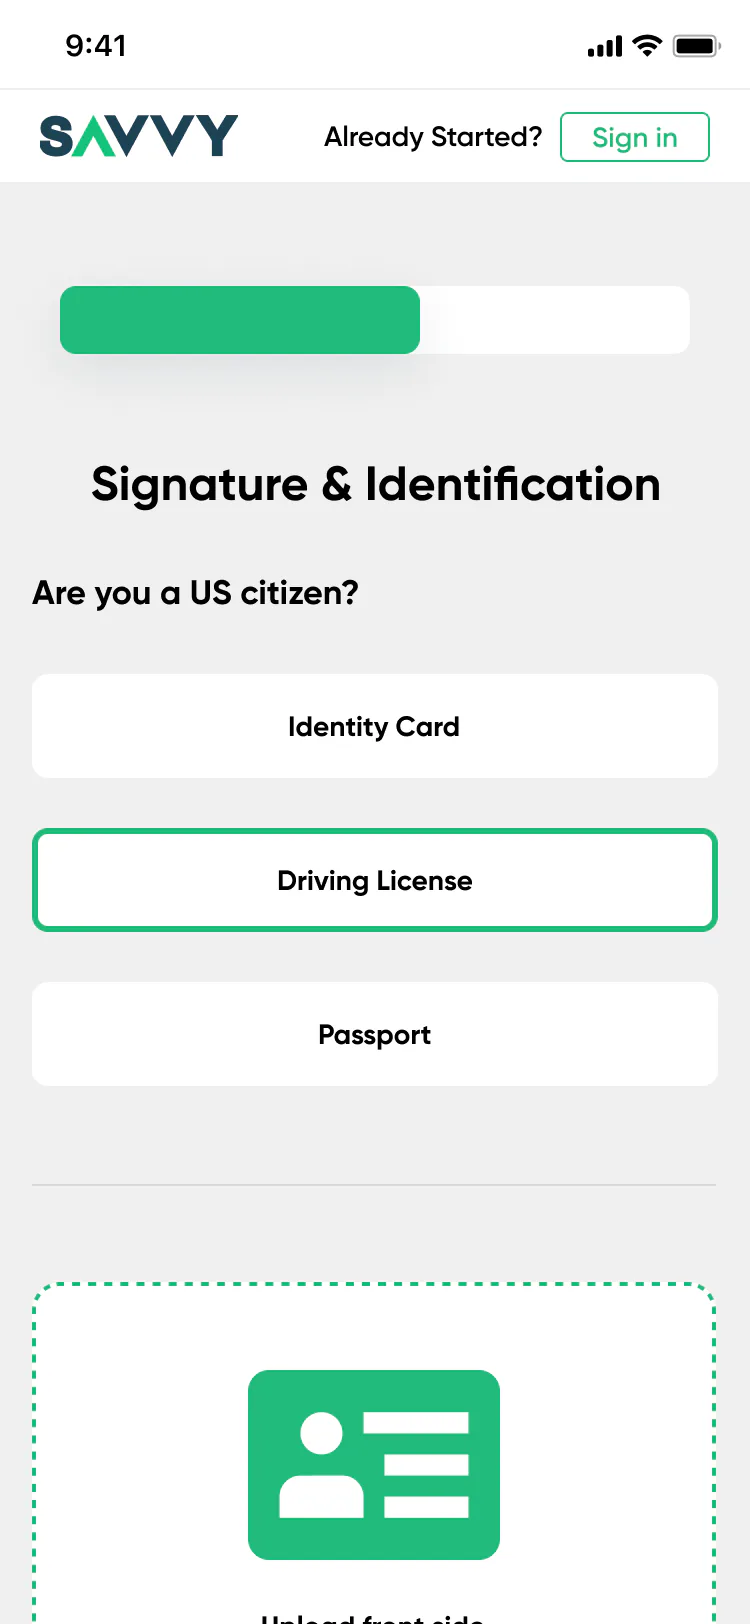
Separate paths for individual, joint and company accounts (LLC, corporation, trust). One topic per step, a progress bar, ID upload and an e-signature. Account types that aren’t ready yet are marked “Coming soon”.
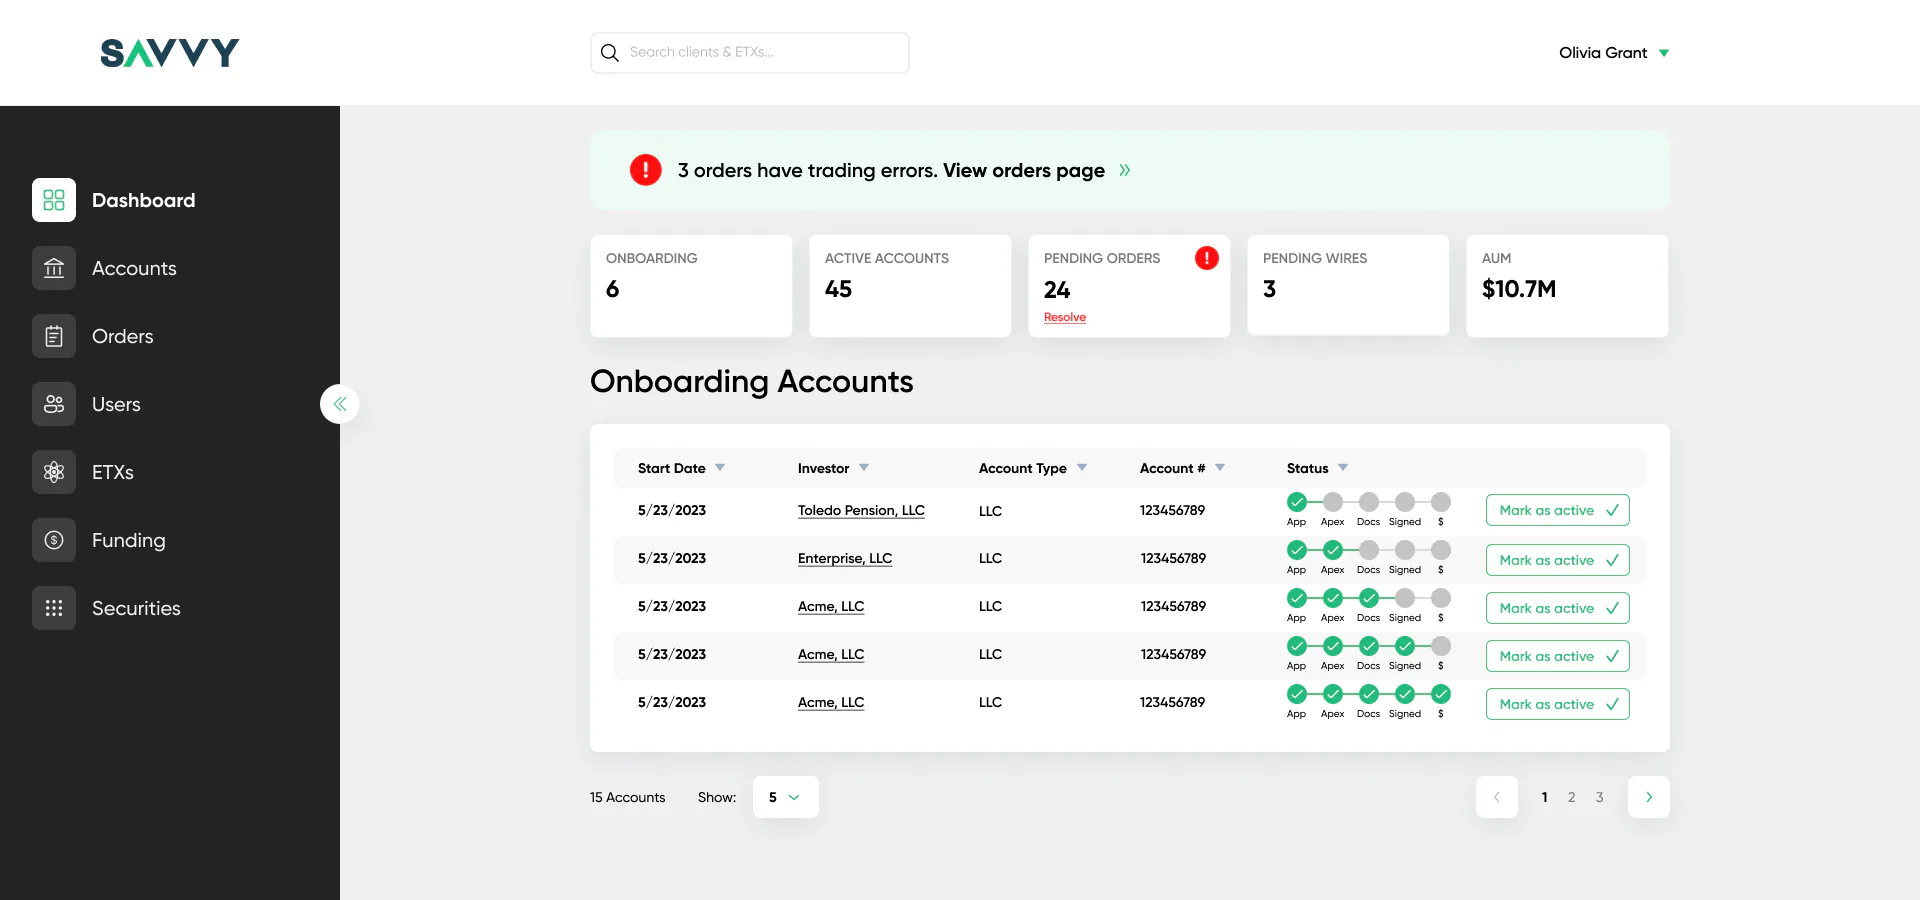
Trading errors appear as a banner at the very top, pending orders get a red mark, and every onboarding account shows its progress step by step: application, broker, documents, signatures, funding.
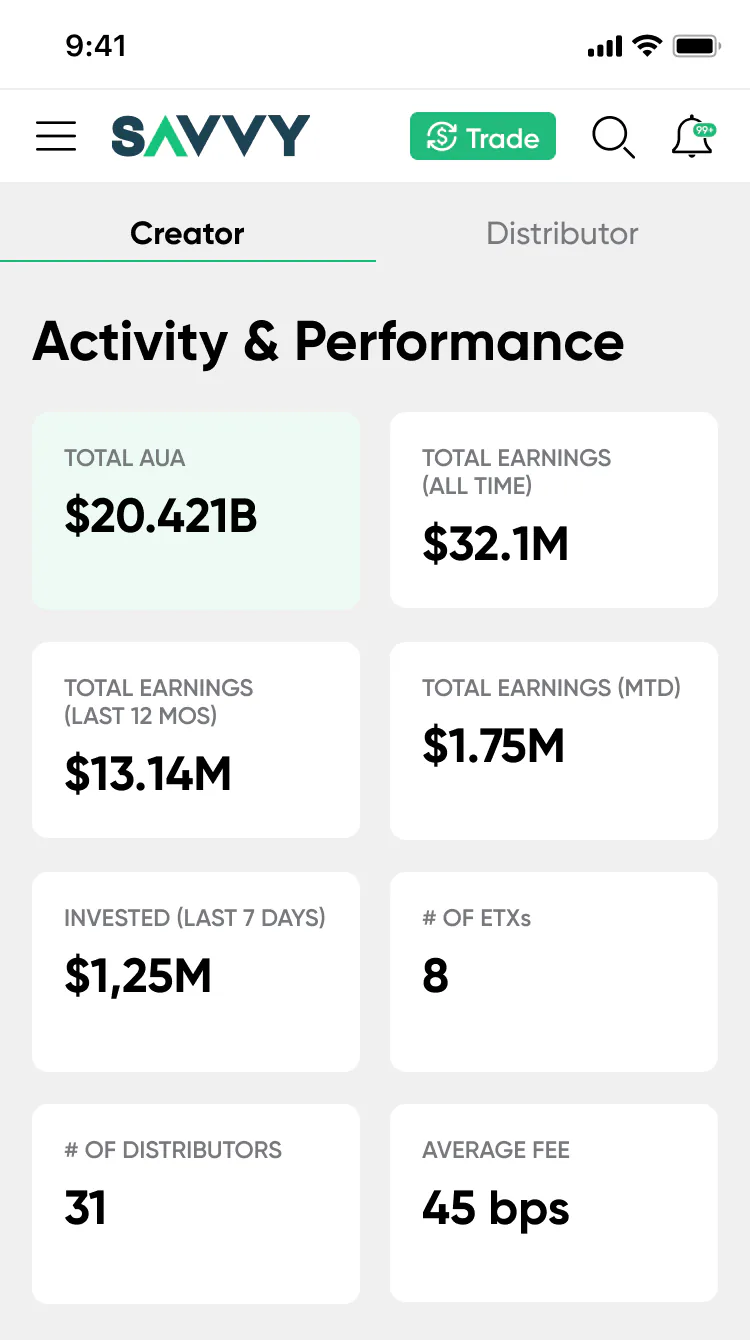
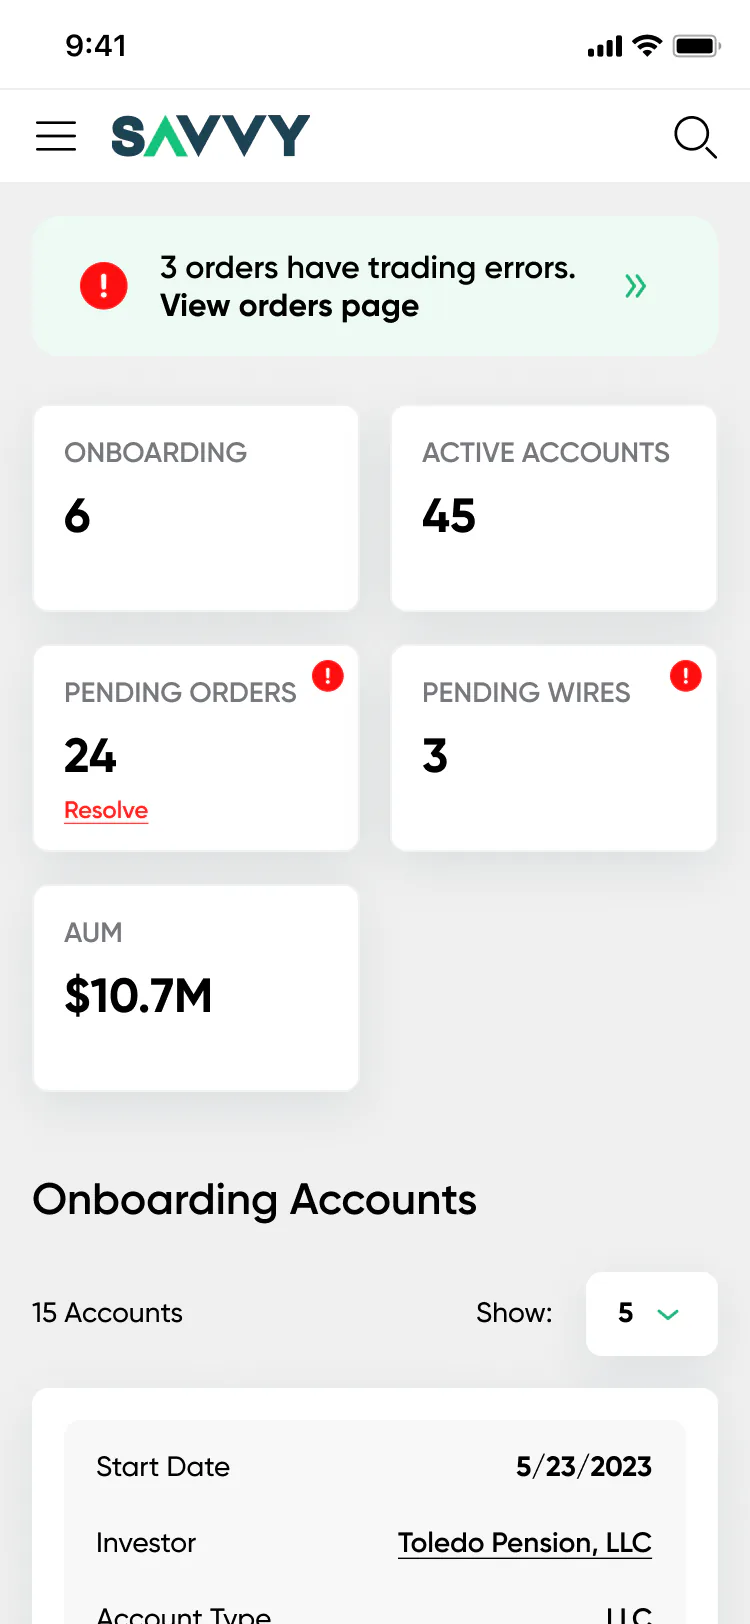
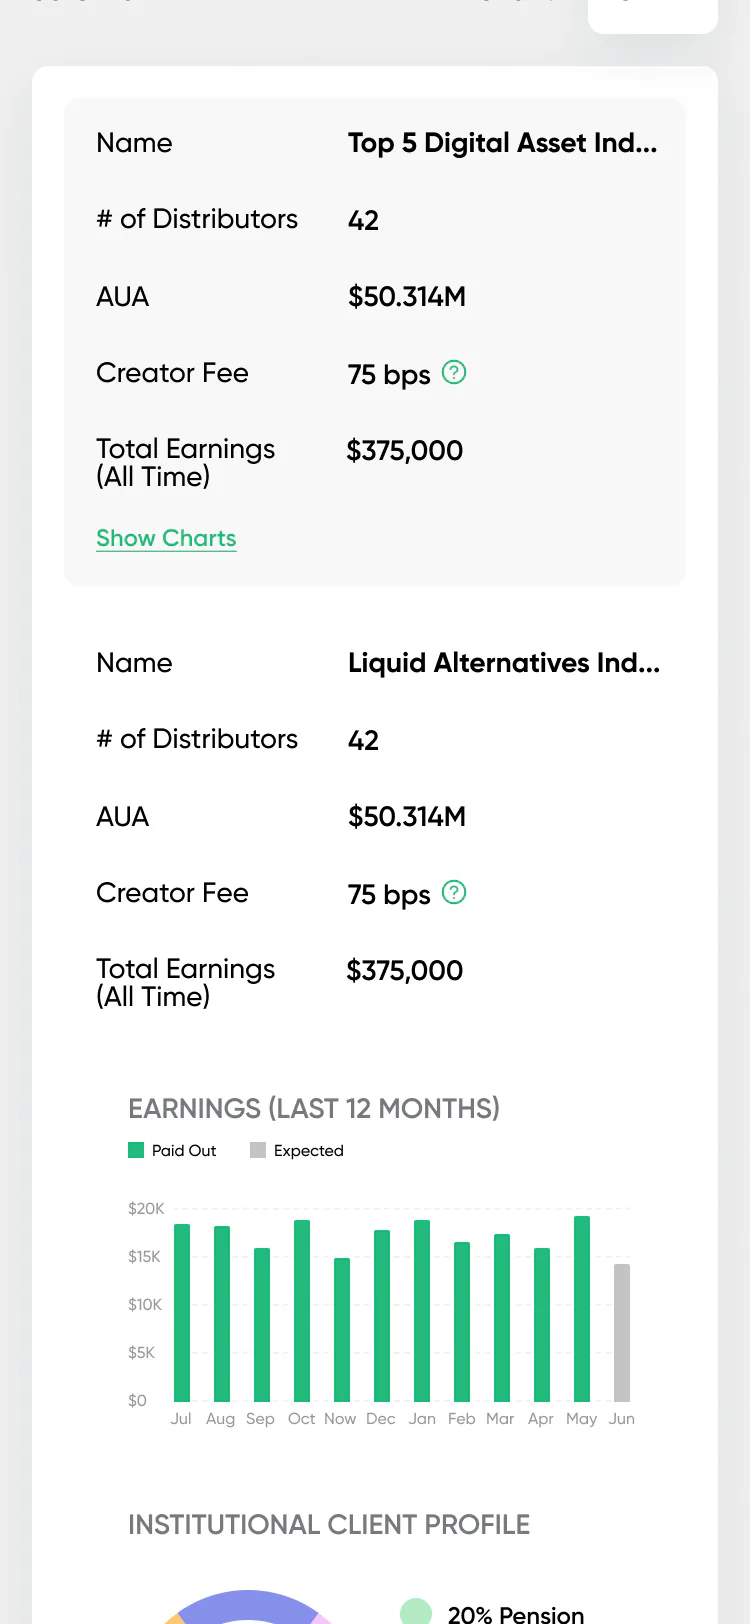
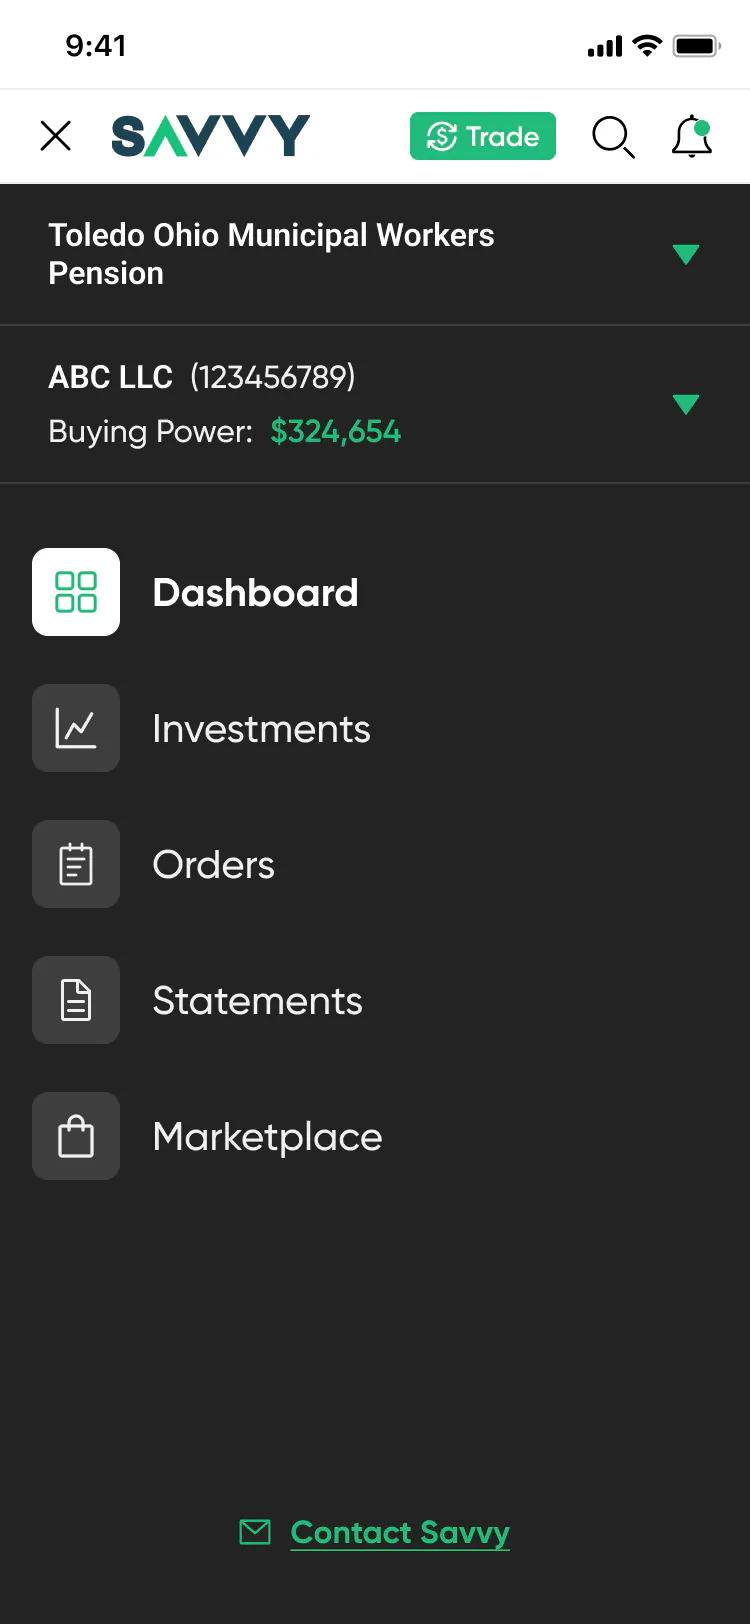
Dense tables turn into cards with label and value pairs. Charts hide behind “Show charts”. The menu holds the client and account switcher with buying power.
UI kit and brand
I built the UI kit for the project. It kept four roles and two platforms in one style, and later helped the second designer pick up the work.
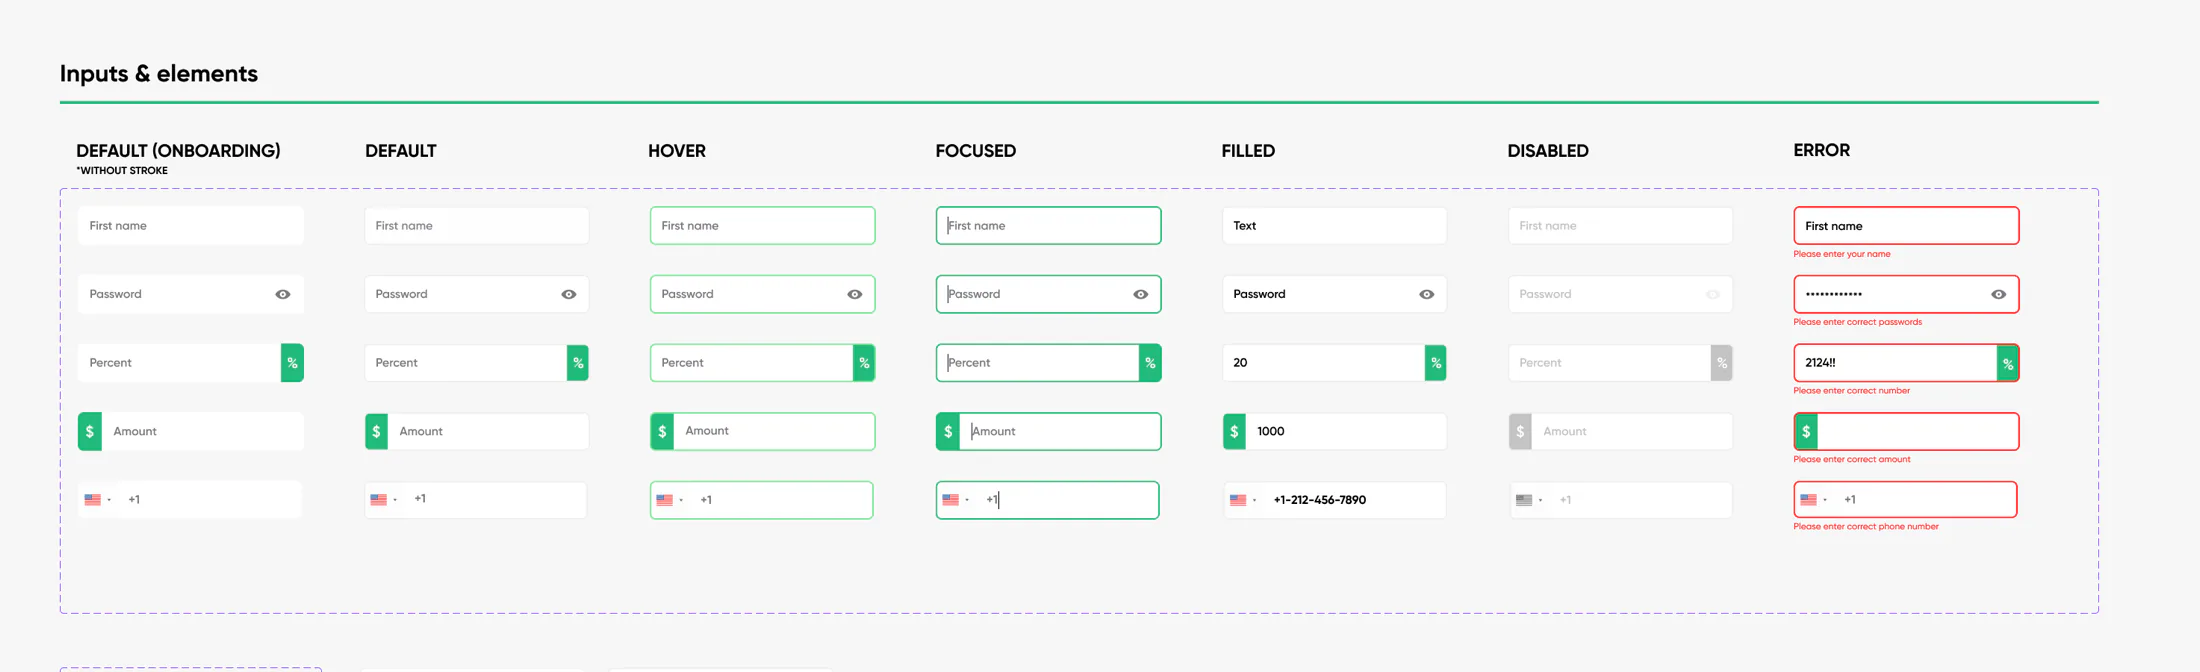
Default, hover, focused, filled, disabled and error states for text, password, percent, amount and phone fields.
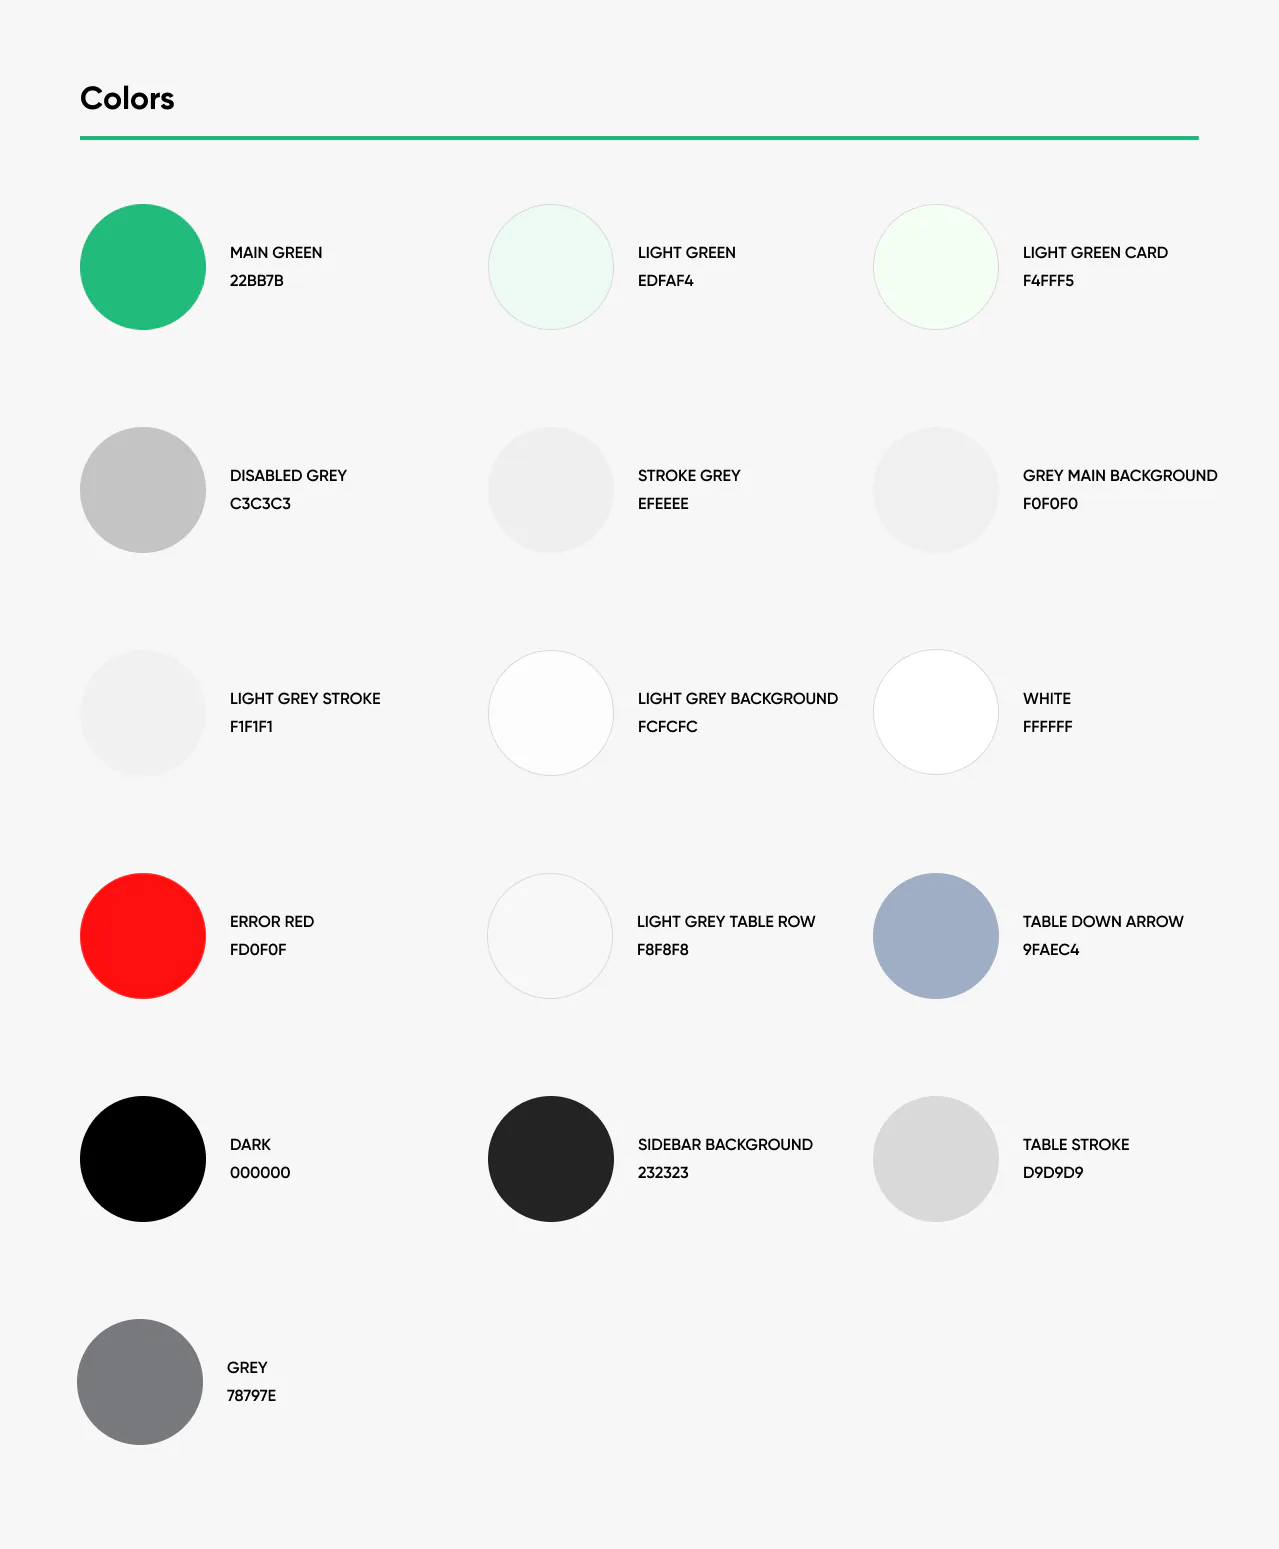
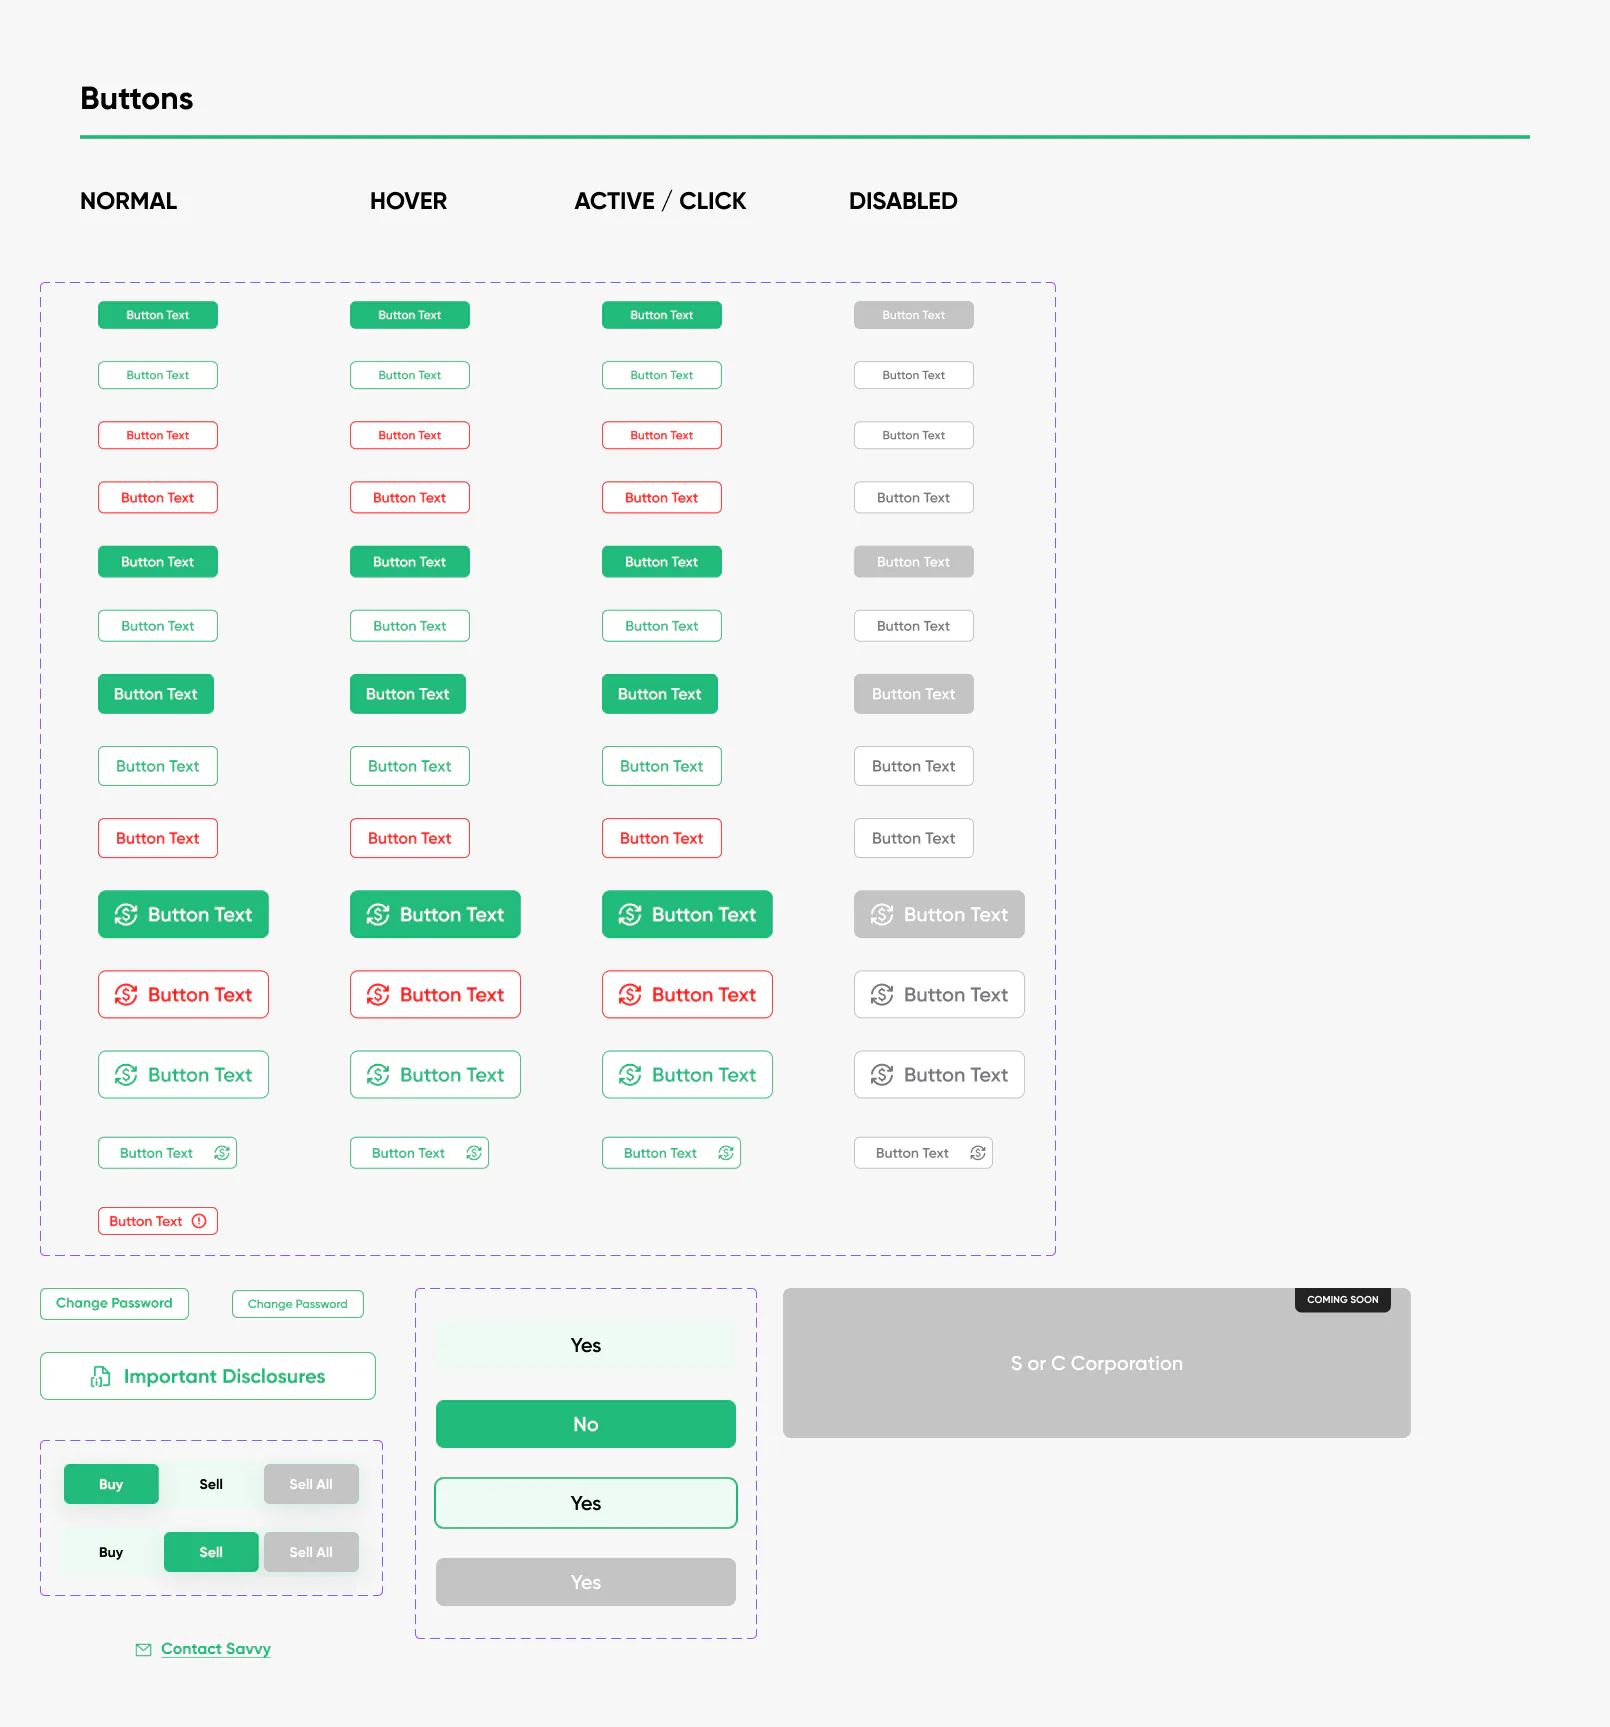
A green brand colour for actions and growth, red for errors, and a set of greys for backgrounds, strokes and table rows. Buttons in normal, hover, active and disabled states.
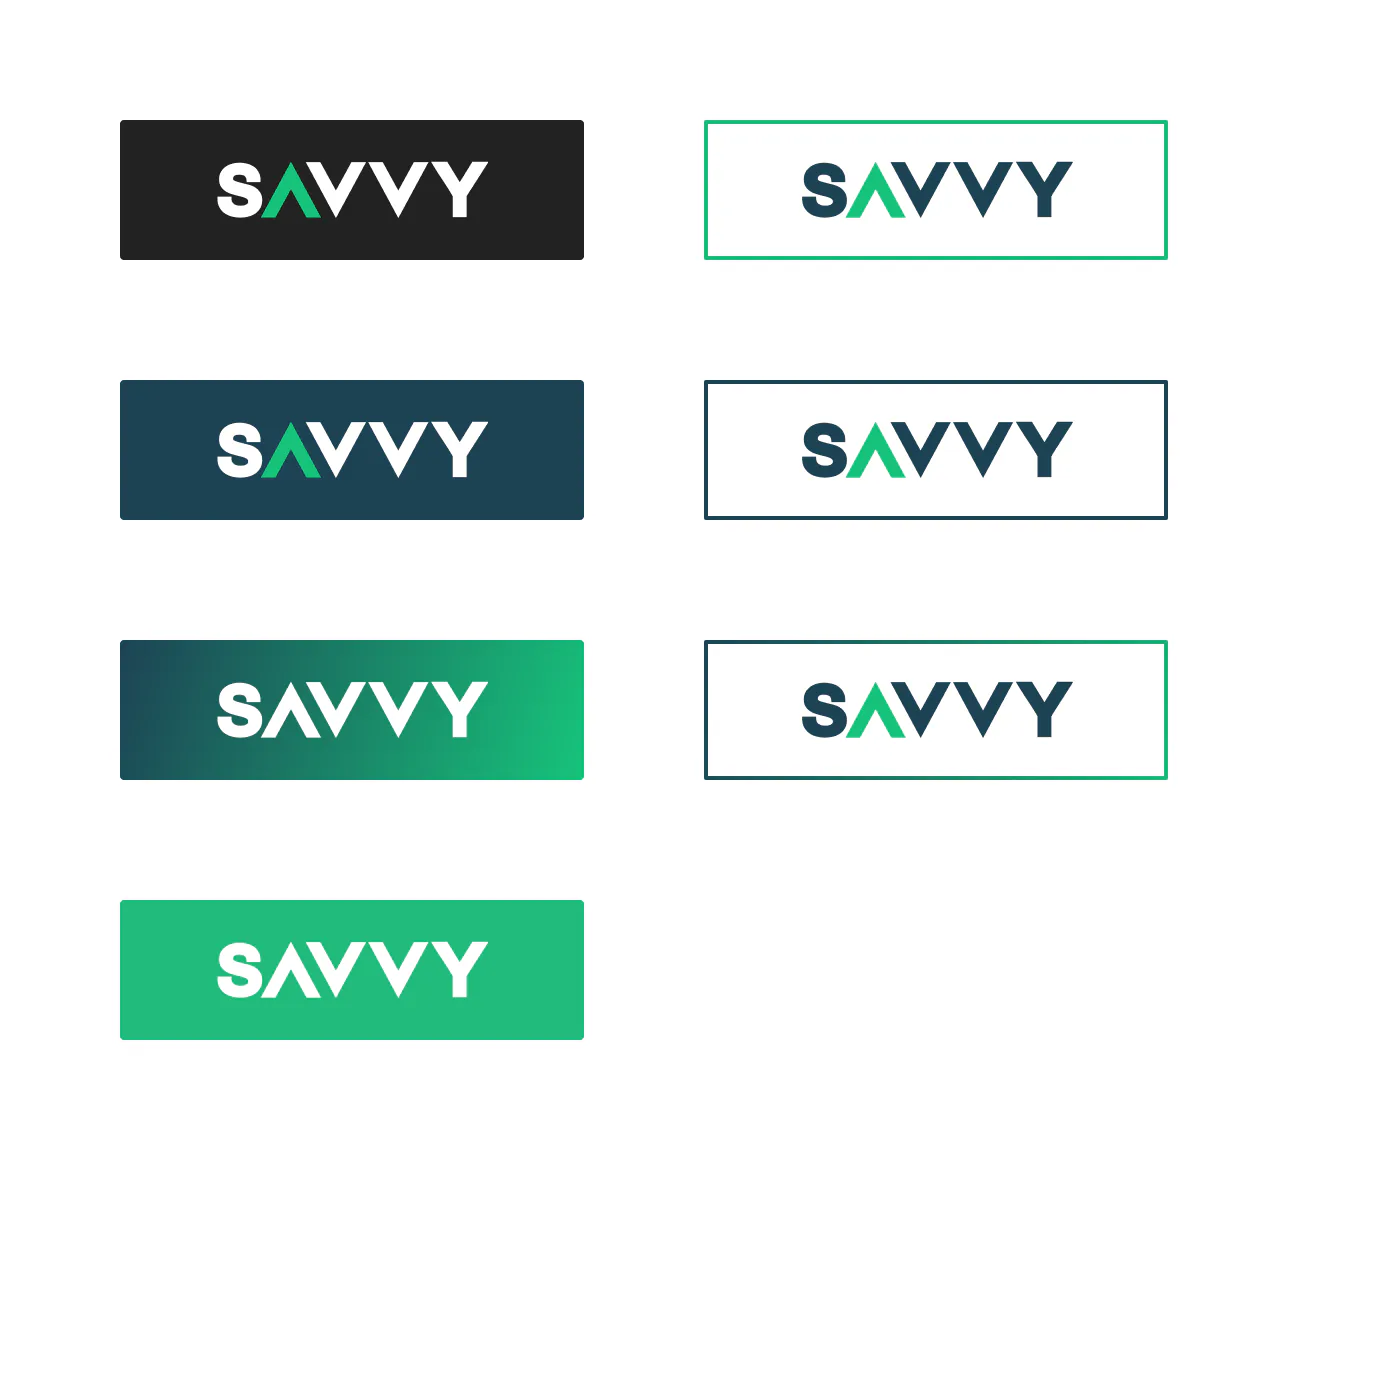
The Savvy logo with an arrow inside the A, its versions for dark and light backgrounds, a banner and backgrounds for video calls.